
When WriteLog control site connects to a remote WriteLog that has SDRs, SDR displays on the Band Maps at the remote temporarily cease, and the SDRs are displayed on the control site Band Maps only.
The only significant difference between local and remote SDR displays on Band Maps is that the bandwidth requirement for the spectra data flowing from the remote to the control site can exceed what the internet connection can accomplish. When this happens, WriteLog outlines the Band Map in red like this.
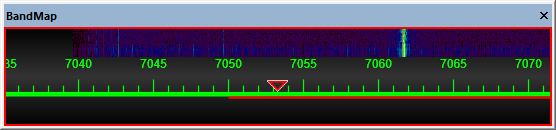
That red outline means WriteLog is discarding SDR spectra calculated on the remote that would otherwise be sent over the internet to the control site.
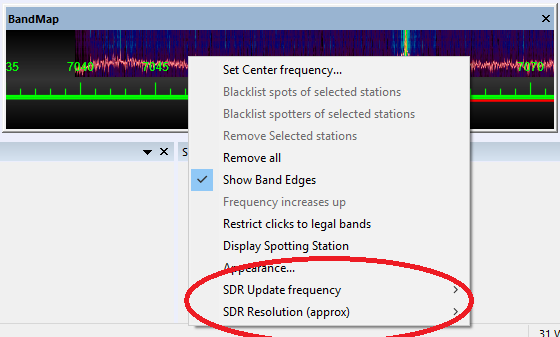
The internet bandwidth requirement depends on two Band Map settings (on its right mouse button):
- SDR update frequency
- SDR resolution
The higher the update frequency, the more bandwidth is required and the lower the resolution Hz setting, the more bandwidth is required. At the remote site, WriteLog limits its CPU resource usage to one CPU core for each SDR regardless of those settings. That limit is why increasing the update rate doesn’t always have an effect—even at the remote site—and, similarly, lowering the resolution setting can have the side effect of lowering the update rate. The actual internet bandwidth required for a given update frequency and resolution also depends on the sample rate of the SDR. For example, a 48KHz sample rate SDR displays 48KHz wide on a Band Map and requires half the internet bandwidth of a 96KHz sample rate SDR. WriteLog’s SDR setup wizard (at the remote site only) has a screen (its the last one in the wizard) that can be used to reduce the sample rate of an SDR that otherwise has no sample rate setting.